The digital Standard Celeration Chart
The Standard Celeration Chart.
Simple.
More powerful than any line graph — and easier than it looks. SimpleSCC makes the chart effortless to learn, read, and share, so you can focus on the learner.
No credit card required.
The app
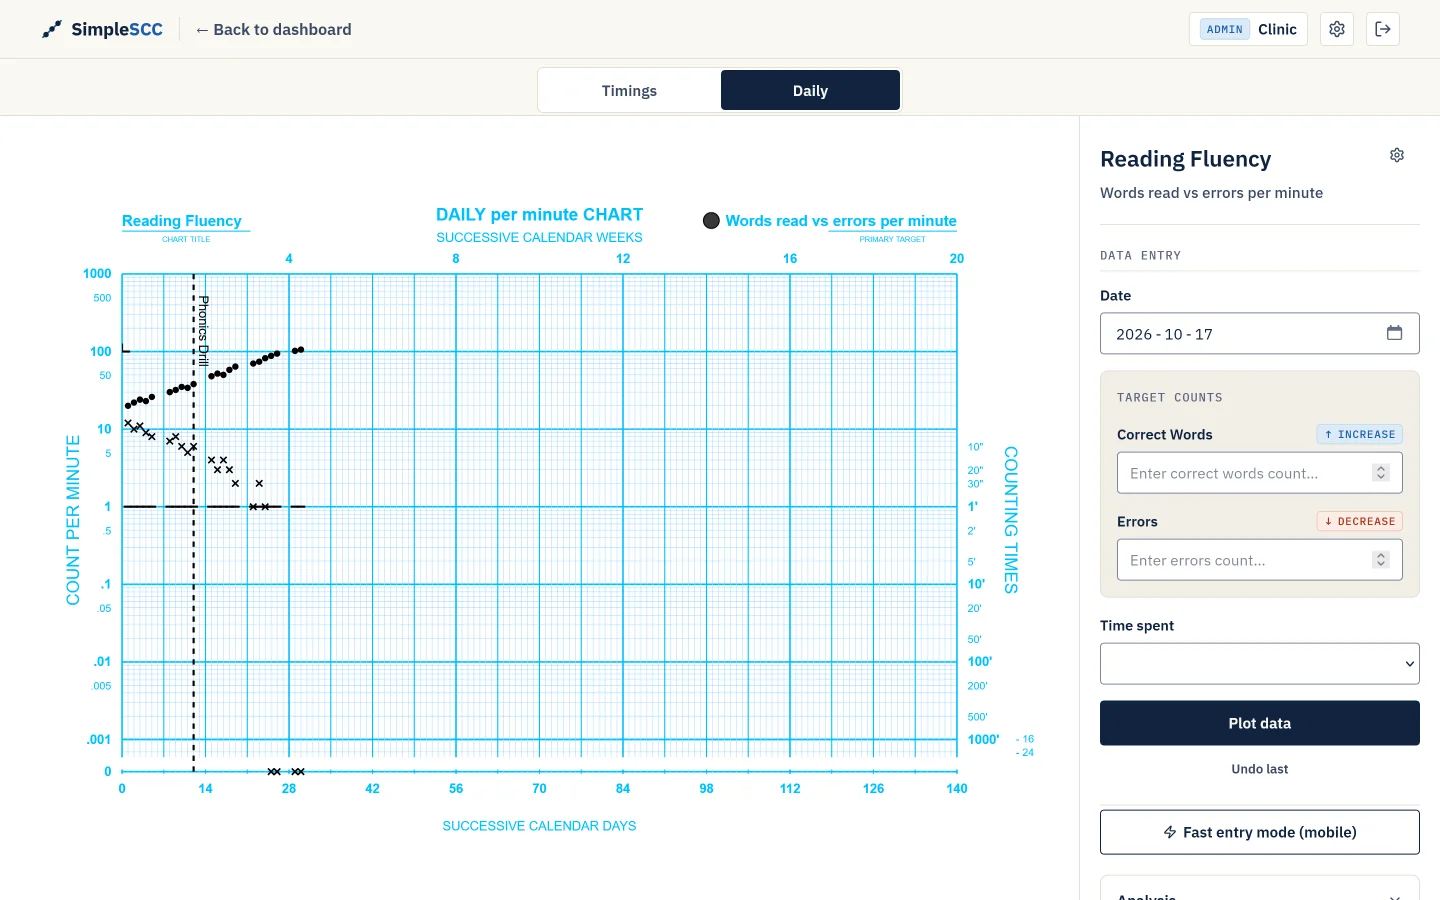
The whole chart, on one screen
Log a session and watch it land: celeration lines, bounce, phase changes, and aims, drawn for you.
How it works
From session to chart in three steps
- 01
Log the session
Enter counts and timing on any device. Fast-entry mode keeps it to a few taps mid-session.
- 02
The chart draws itself
Points land on the semi-log scale, with celeration and bounce calculated for you.
- 03
Share the picture
Export clean PDF, PNG, and CSV reports for supervision and team meetings.
Who it's for
Built for the whole team
BCBA
Every client and program in one caseload, with celeration, bounce, and phase changes calculated for you.
RBT
A distraction-free fast-entry mode for logging data mid-session, on a phone or tablet.
Clinic director
Invite staff with a six-character join code and keep every chart under one clinic.
New to the Standard Celeration Chart?
You don't need to be a Precision Teacher to start. Two short reads cover the essentials.